Generating Reports and Exports with Timing
Table of Contents
Easy Reports
By now, your time is hopefully well categorized into projects and you have an idea where your time goes.
But how do you use that information, e.g. to bill your clients?
While Timing can't create invoices by itself, it has plenty of options to help you do so.
First, select the Reports tab in the sidebar:
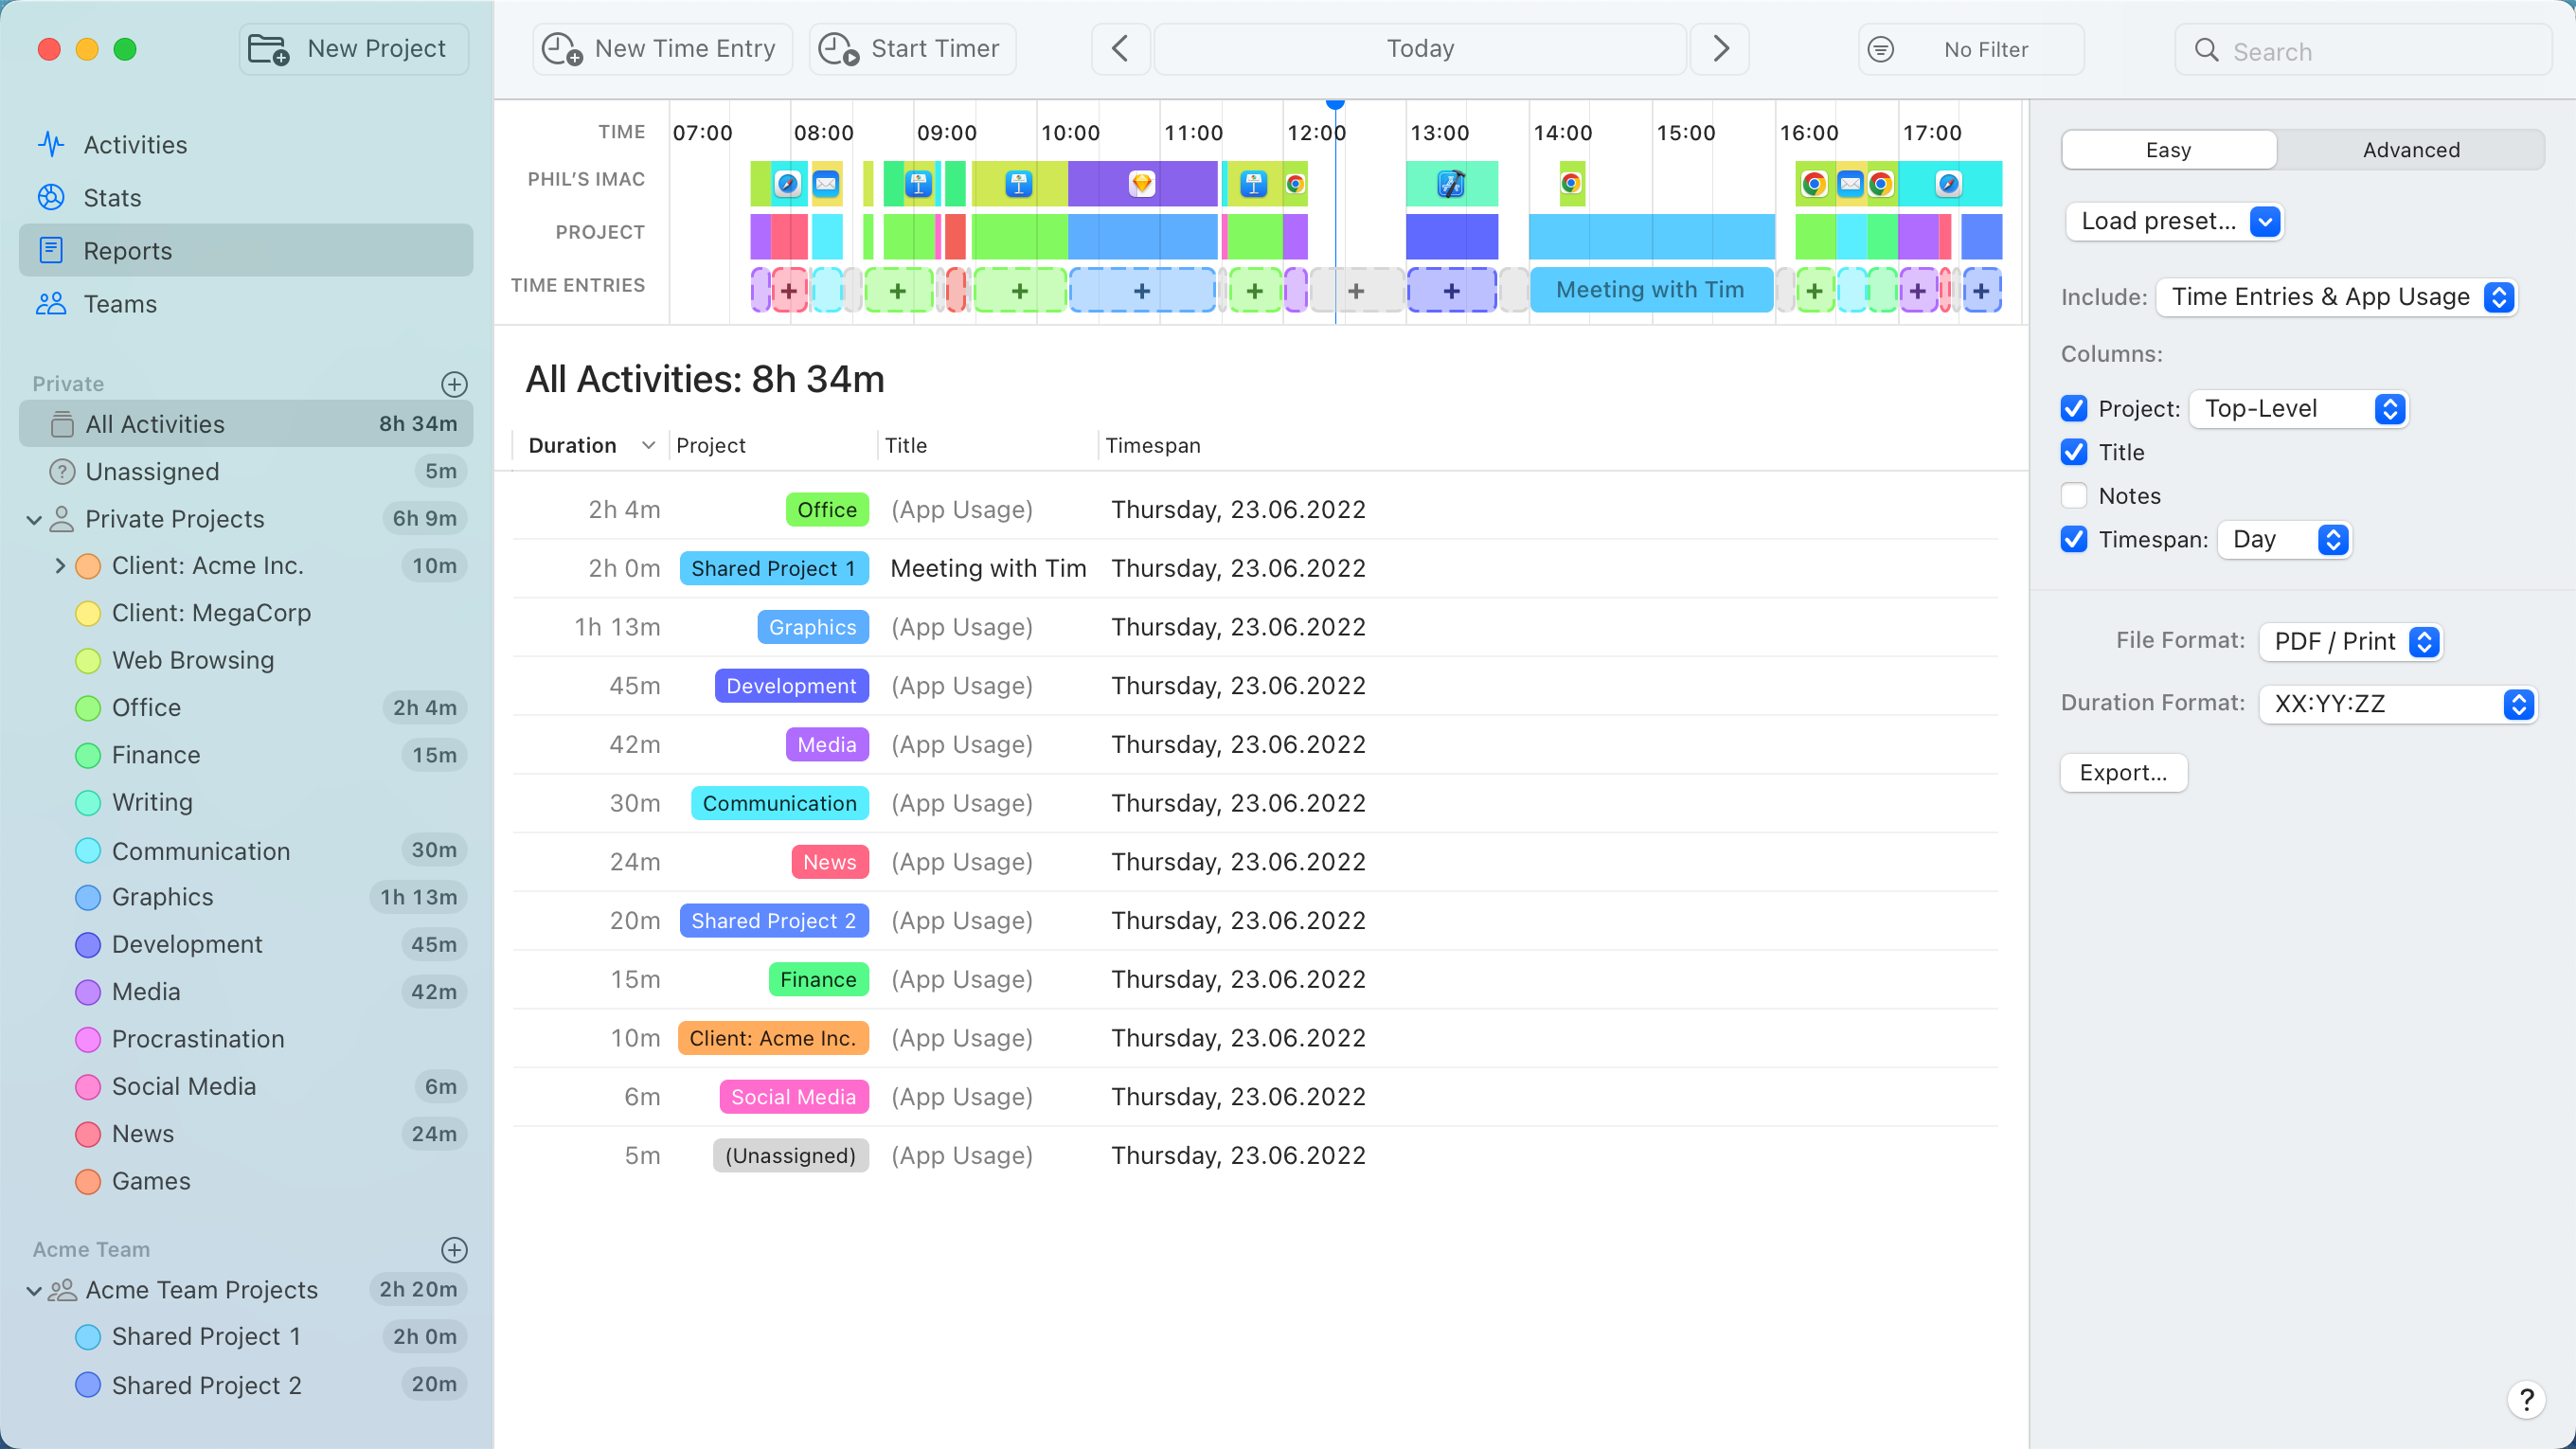 This screen lets you quickly generate a report with one of the built-in presets, or customize the report to your liking.
We've intentionally kept this screen simple, to avoid overwhelming you or your clients with information that you don't need for billing. But there are a few options to choose from:
- Include. Lets you choose whether the report should include only time entries that you created manually, or also the app usage that Timing has recorded automatically for you.
- Columns. If you don't need your report to include information such as a time entry's notes,
uncheck the corresponding columns for a cleaner look. If you have enabled billing status tracking, you can also include a billing status column to track which entries have been billed and paid. In addition, two of the columns let you choose from
different modes:
- Project. You can either include exactly the project that the time entry belongs to, or its corresponding "parent project" on the top or second level of your project hierarchy. This can help you get a broad overview of where your time went, without getting bogged down by details.
- Timespan. Provides options to group your times by day, week, month or year, or show each time entry's exact start and end time. Note that in "Exact" mode, timespans for app usage will not be shown. This is because each individual app usage entry can be just a few seconds short, resulting in a report with thousands of lines. If you do need each app usage entry's individual timespan, consider using the Advanced report mode instead.
- Rounding. To create cleaner timesheets, you can round time entry durations up, down, or to the nearest interval. This is especially useful when billing clients in fixed increments (e.g., rounding to the nearest 15 minutes or 6 minutes for easier invoicing). Available rounding intervals include 1, 5, 6, 10, 12, 15, and 30 minutes, as well as 1 hour.
- Up to: Round durations up to the next interval (e.g., 2 minutes becomes 5 minutes with 5-minute rounding).
- Down to: Round down to the previous interval (e.g., 4 minutes 59 seconds becomes 0 minutes with 5-minute rounding).
- To nearest: Round to the nearest interval (e.g., 2 minutes 30 seconds becomes 5 minutes with 5-minute rounding).
Rounding is only available for Easy reports and the web app, but not for Advanced reports.
When you are satisfied with the contents of your report, select the desired formatting options, then press "Export":
- File Format. Timing lets you choose among four export formats:
- Excel. Exports your data as an XLSX spreadsheet for further processing.
- CSV. "Comma-Separated Values" format. Mostly useful for importing this data into other apps, such as your invoicing tool.
- PDF / Print. The perfect format when you want to provide a timesheet along your invoice, for example.
- HTML. Looks similar to the PDF format, but better suited for manual customization or hosting on a website.
- JSON. This is a format that can be easily read by other software. Helpful in case you'd like to send the export to a script for further processing.
- Duration Format. Lets you customize how durations are output in exports:
- XX:YY:ZZ. Would output e.g. 01:02:03 for one hour, two minutes and three seconds.
- Xh Ym Zs. Would output 1h 2m 3s.
- Fractional seconds. Would output 3723 — this is useful for e.g. later adding several durations in Excel.
- Fractional hours. Would output 1.034 — this is useful for e.g. later adding several durations in Excel.
Advanced Reports
When you select the "Advanced" mode in the sidebar, you can use a different set of settings:
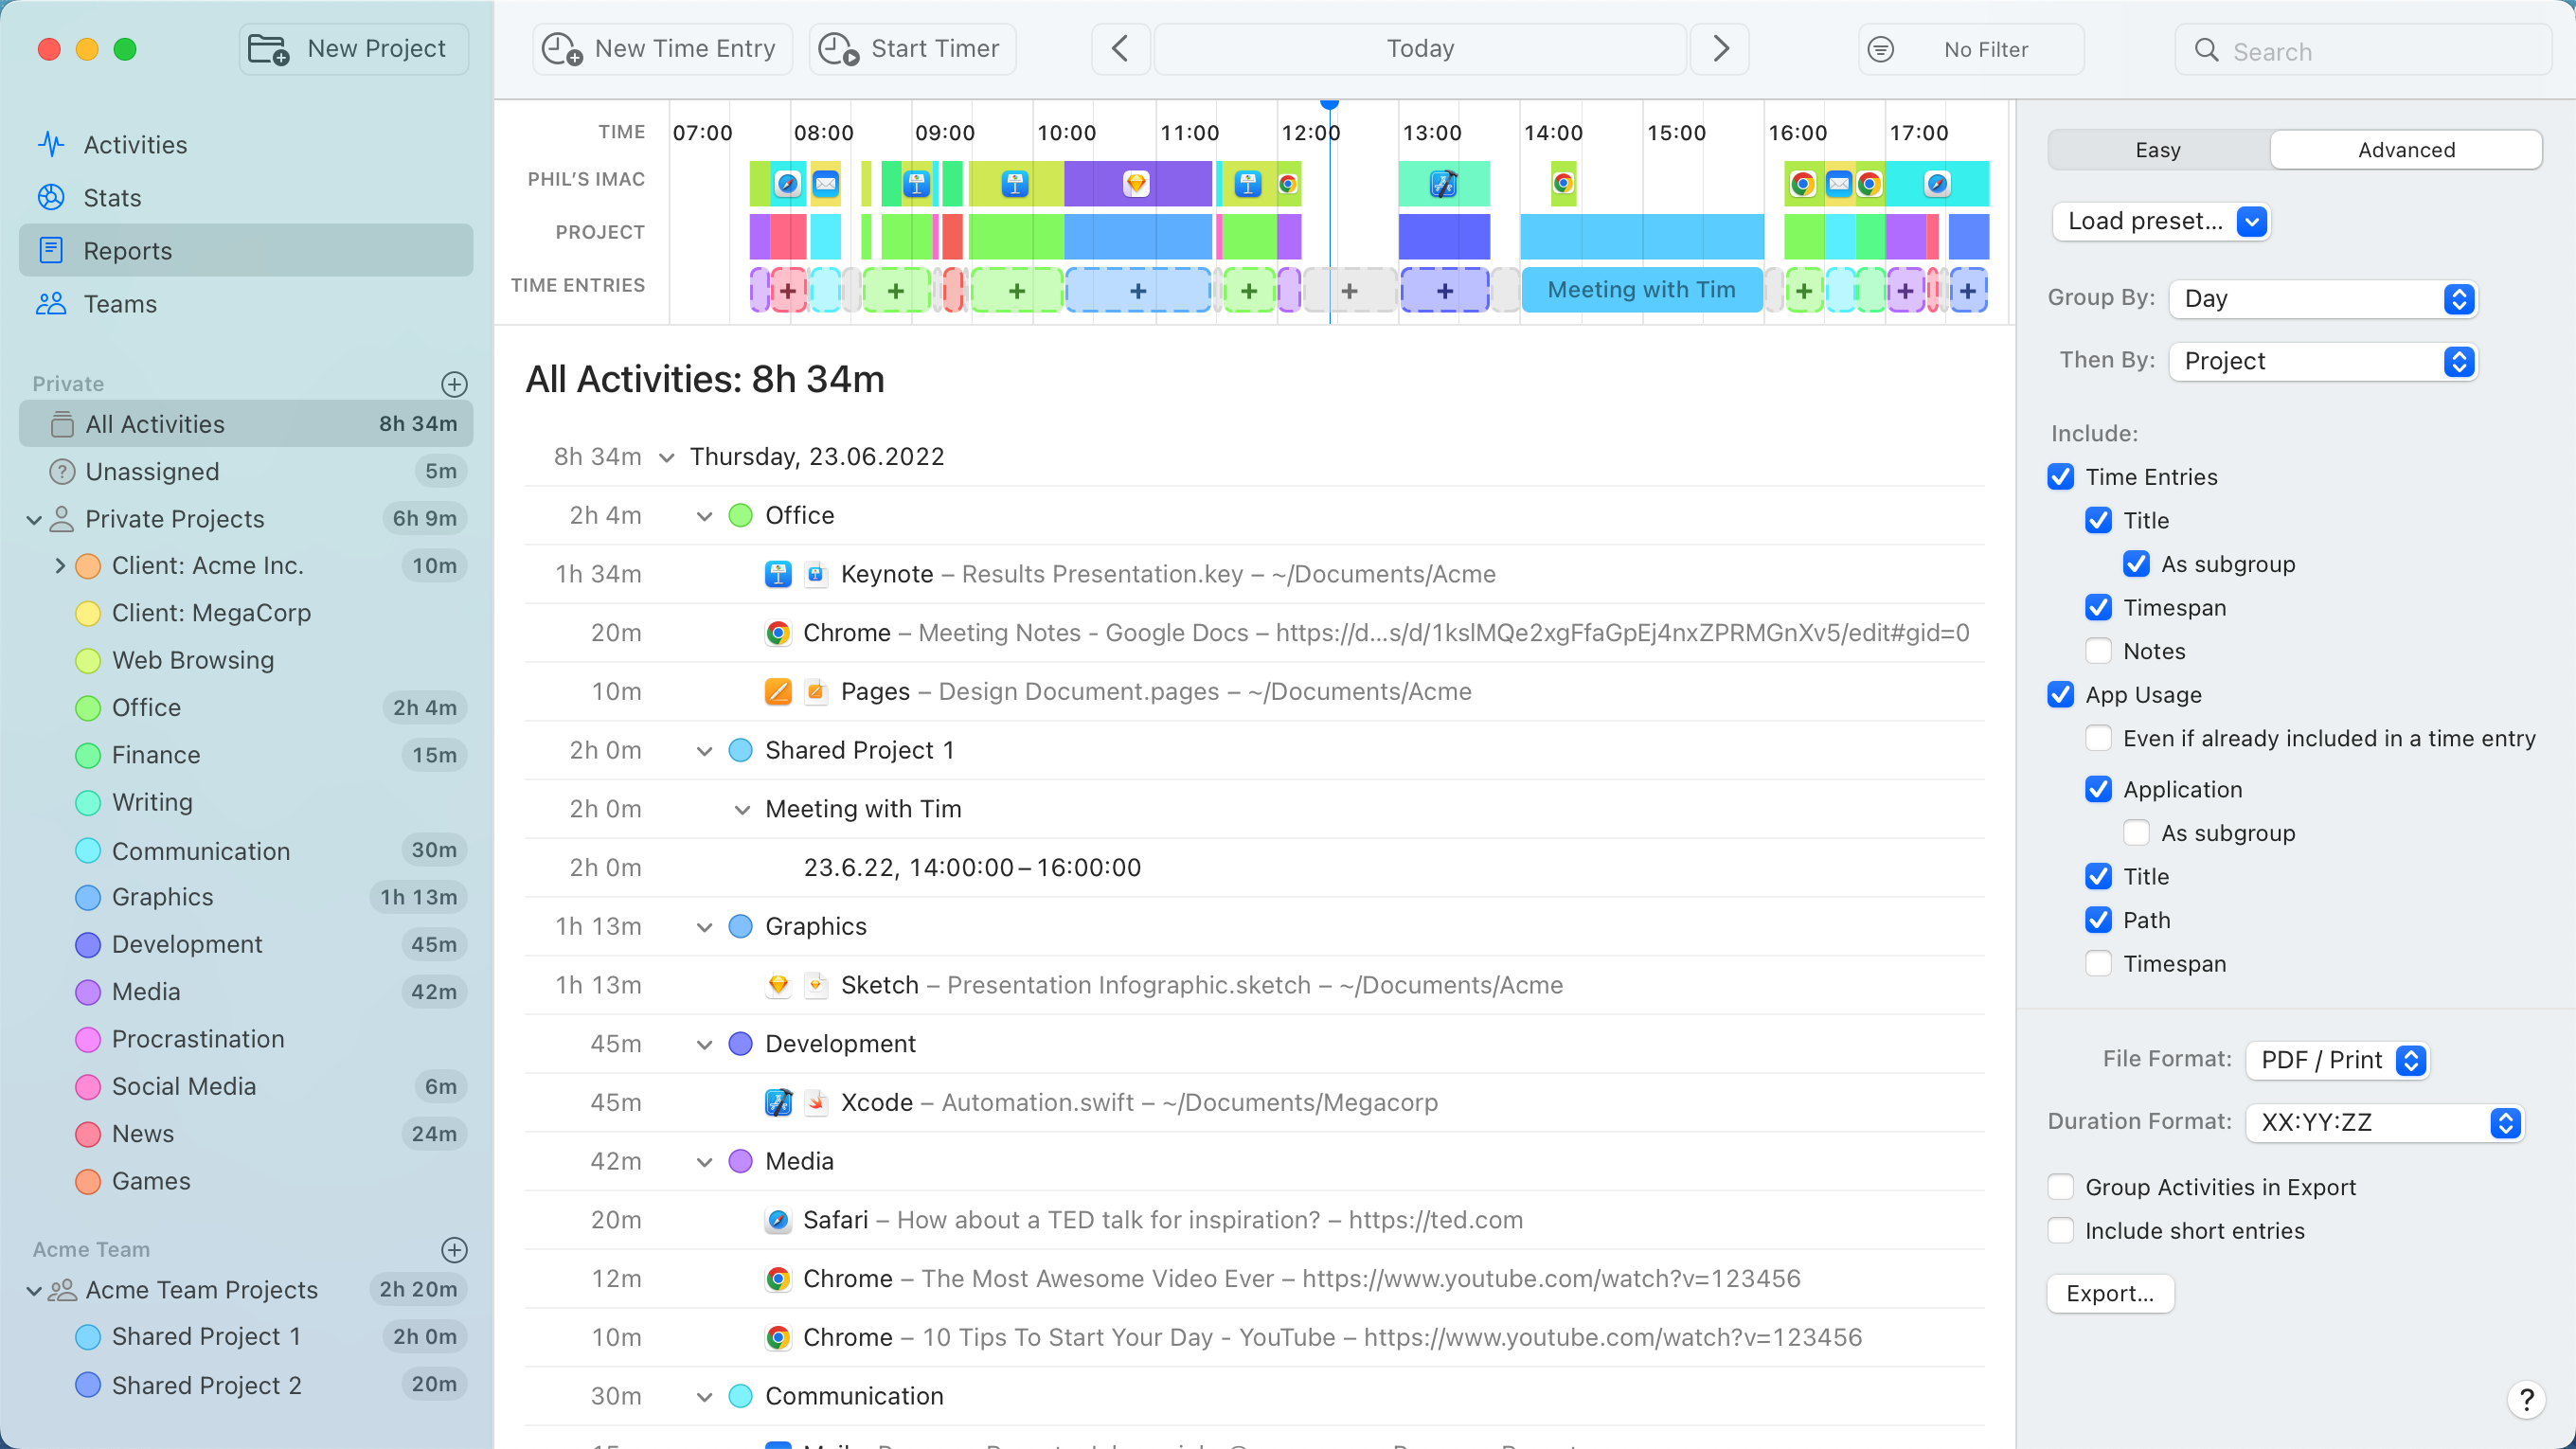
- Presets. Lets you select one of Timing's default reports:
- Timesheet. Shows how much time you spent each day, broken down per project.
Time that you explicitly accounted for (with time entries) is listed next to the remaining "app time" you spent on those projects. - Timesheet (Week + Day). Like the above, but broken down per week and per day rather than per project.
If you want to prepare a timesheet for a client, this preset is a good start.
You might also want to restrict the report to individual projects by selecting them in the project list. - Timesheet (Week + Day + Notes). Like the above, but also contains the notes of each time entry.
- Weekly Snippet. When I used to work at Google, we'd send a weekly report of what we did to our managers.
This report facilitates that: It contains everything you did, broken down per week.
It is particularly useful if you block your time into time entries. - Time Per Project. Breaks down how much time you spent on each project.
This report is similar to the "Projects" card on the Overview screen. - Time Per App. Breaks down how much time you spent on each app.
This report is similar to the "Apps" card on the Overview screen. - Time Per Document. Like the above, but further broken down by which documents and websites you viewed.
- Ultra-Detailed. This report contains as much information as possible. Only useful in a few cases.
- Raw Time Entries. Displays all time entries in a chronological fashion, similar to how they are stored in the database.
Mostly useful if you want to further process this data using other tools. - Raw App Usage. Like the above, but for app activities.
- Timesheet. Shows how much time you spent each day, broken down per project.
- Group By. Lets you group the data in your report by time period (Year/Month/Week/Day) or by project.
- Top-level/second-level project. Requires Timing Expert You can also group by "top-level project" or "second-level project". For example, if you have a project called "Project A" as a sub-project of "Client X", "Client X" would be the top-level project and "Project A" the second-level project. This should make it easier to generate reports spanning multiple sub-projects.
- Project (Hierarchical). Requires Timing Expert Allows you to group by any number of nested project levels. Unlike the fixed "top-level" and "second-level" options, hierarchical grouping dynamically creates a separate column for each level in your project hierarchy. For example, if you have "Client X > Project A > Task 1", you would get three columns: "Project Level 1" (Client X), "Project Level 2" (Project A), and "Project Level 3" (Task 1). This is especially useful when you have deeply nested project structures and need each level represented in your exports.
- Include. What kind of information to include in the report. Requires Timing Expert
The more you select, the longer and more detailed the reports gets.- As subgroup. Specifies whether you want the report to display time entry titles or application names as a separate level.
This gives the report a bit more structure, possibly making it easier to browse.
Note that this only affects how reports are displayed in Timing, but not how they are exported. - Even if already included in a Time Entry. When a particular time range is covered by a time entry,
all app usage inside that time range becomes "absorbed" by that time entry.
Accordingly, if this option is unchecked, those activities won't show up in the report at all — they don't contribute to the time total anyway (because that total is already provided by the enclosing time entry).
- As subgroup. Specifies whether you want the report to display time entry titles or application names as a separate level.
- Billing Status Filter. If you have enabled billing status tracking, you can filter which time entries are included in the report based on their billing status. For example, you could generate a report showing only "Billable" entries that still need to be invoiced, or only "Billed" entries for a specific time period (to see which time entries still have outstanding payments). Leave this empty to include all time entries regardless of billing status.
This mode also provides two additional export settings:
- Group Activities in Export. If selected, the criteria selected in Group By above will also be reflected as groups in the report.
This is only available for PDF and HTML export, as table-style exports can't really be grouped. - Include Short Entries. Whether to include entries of the form "(Entries shorter than 1m each)" in the final export.
Automating Exports
There are many use cases in which an automated capability for generating exports would be useful.
For this purpose, we recommend creating an AppleScript that contains exactly the report settings and projects you need, then run that e.g. once per month. You can find an example of such a script on the corresponding documentation page.
In addition, here is a short AppleScript snippet that generates the start and end dates for a given year and month, which you can then plug into the script mentioned above to generate a report for that month:
set desiredYear to 2021
set desiredMonth to 8

set anchorDate to the current date
set the year of anchorDate to desiredYear
set the month of anchorDate to desiredMonth
set the day of anchorDate to 1
set the hours of anchorDate to 0
set the minutes of anchorDate to 0
set the seconds of anchorDate to 0

set startDate to anchorDate
copy startDate to endDate
set the month of endDate to desiredMonth + 1
set endDate to (endDate - 1 * (minutes))