How to Create a Project- or Task-Specific Report in Timing

One of the most powerful benefits of using Timing is that it allows you to export instant reports that include details about how you’ve spent your working hours.
A detailed, project- or task-specific report can be especially useful when it comes to billing clients for your time–but it can also be used for:
- Reviewing your personal time usage on specific projects or clients,
- Estimating time usage/costs for similar projects or clients, and
- Leverage while proposing an increased rate to a client (or potentially, an employer).
In this article, we’ll take a look at how to create a report in Timing, as well as different types of reports you might want to generate to get richer insight into your most valuable resource: your time.
How to Export a Report: A Basic Breakdown
If you’ve ever tried to manually build a timesheet of your working hours and minutes, then you know how tedious and time-consuming it can be. You’ve got to review your time usage, check for accuracy, and input those numbers into a clean, professional-looking format.
Timing essentially automates this task, allowing you to export your time usage into the format of your choice (Excel, CSV, PDF, HTML, or JSON). Your only task here is to choose settings that make the most sense for your report.
Your “Reports tab” will display your total time usage. Here’s an example of what that might look like:
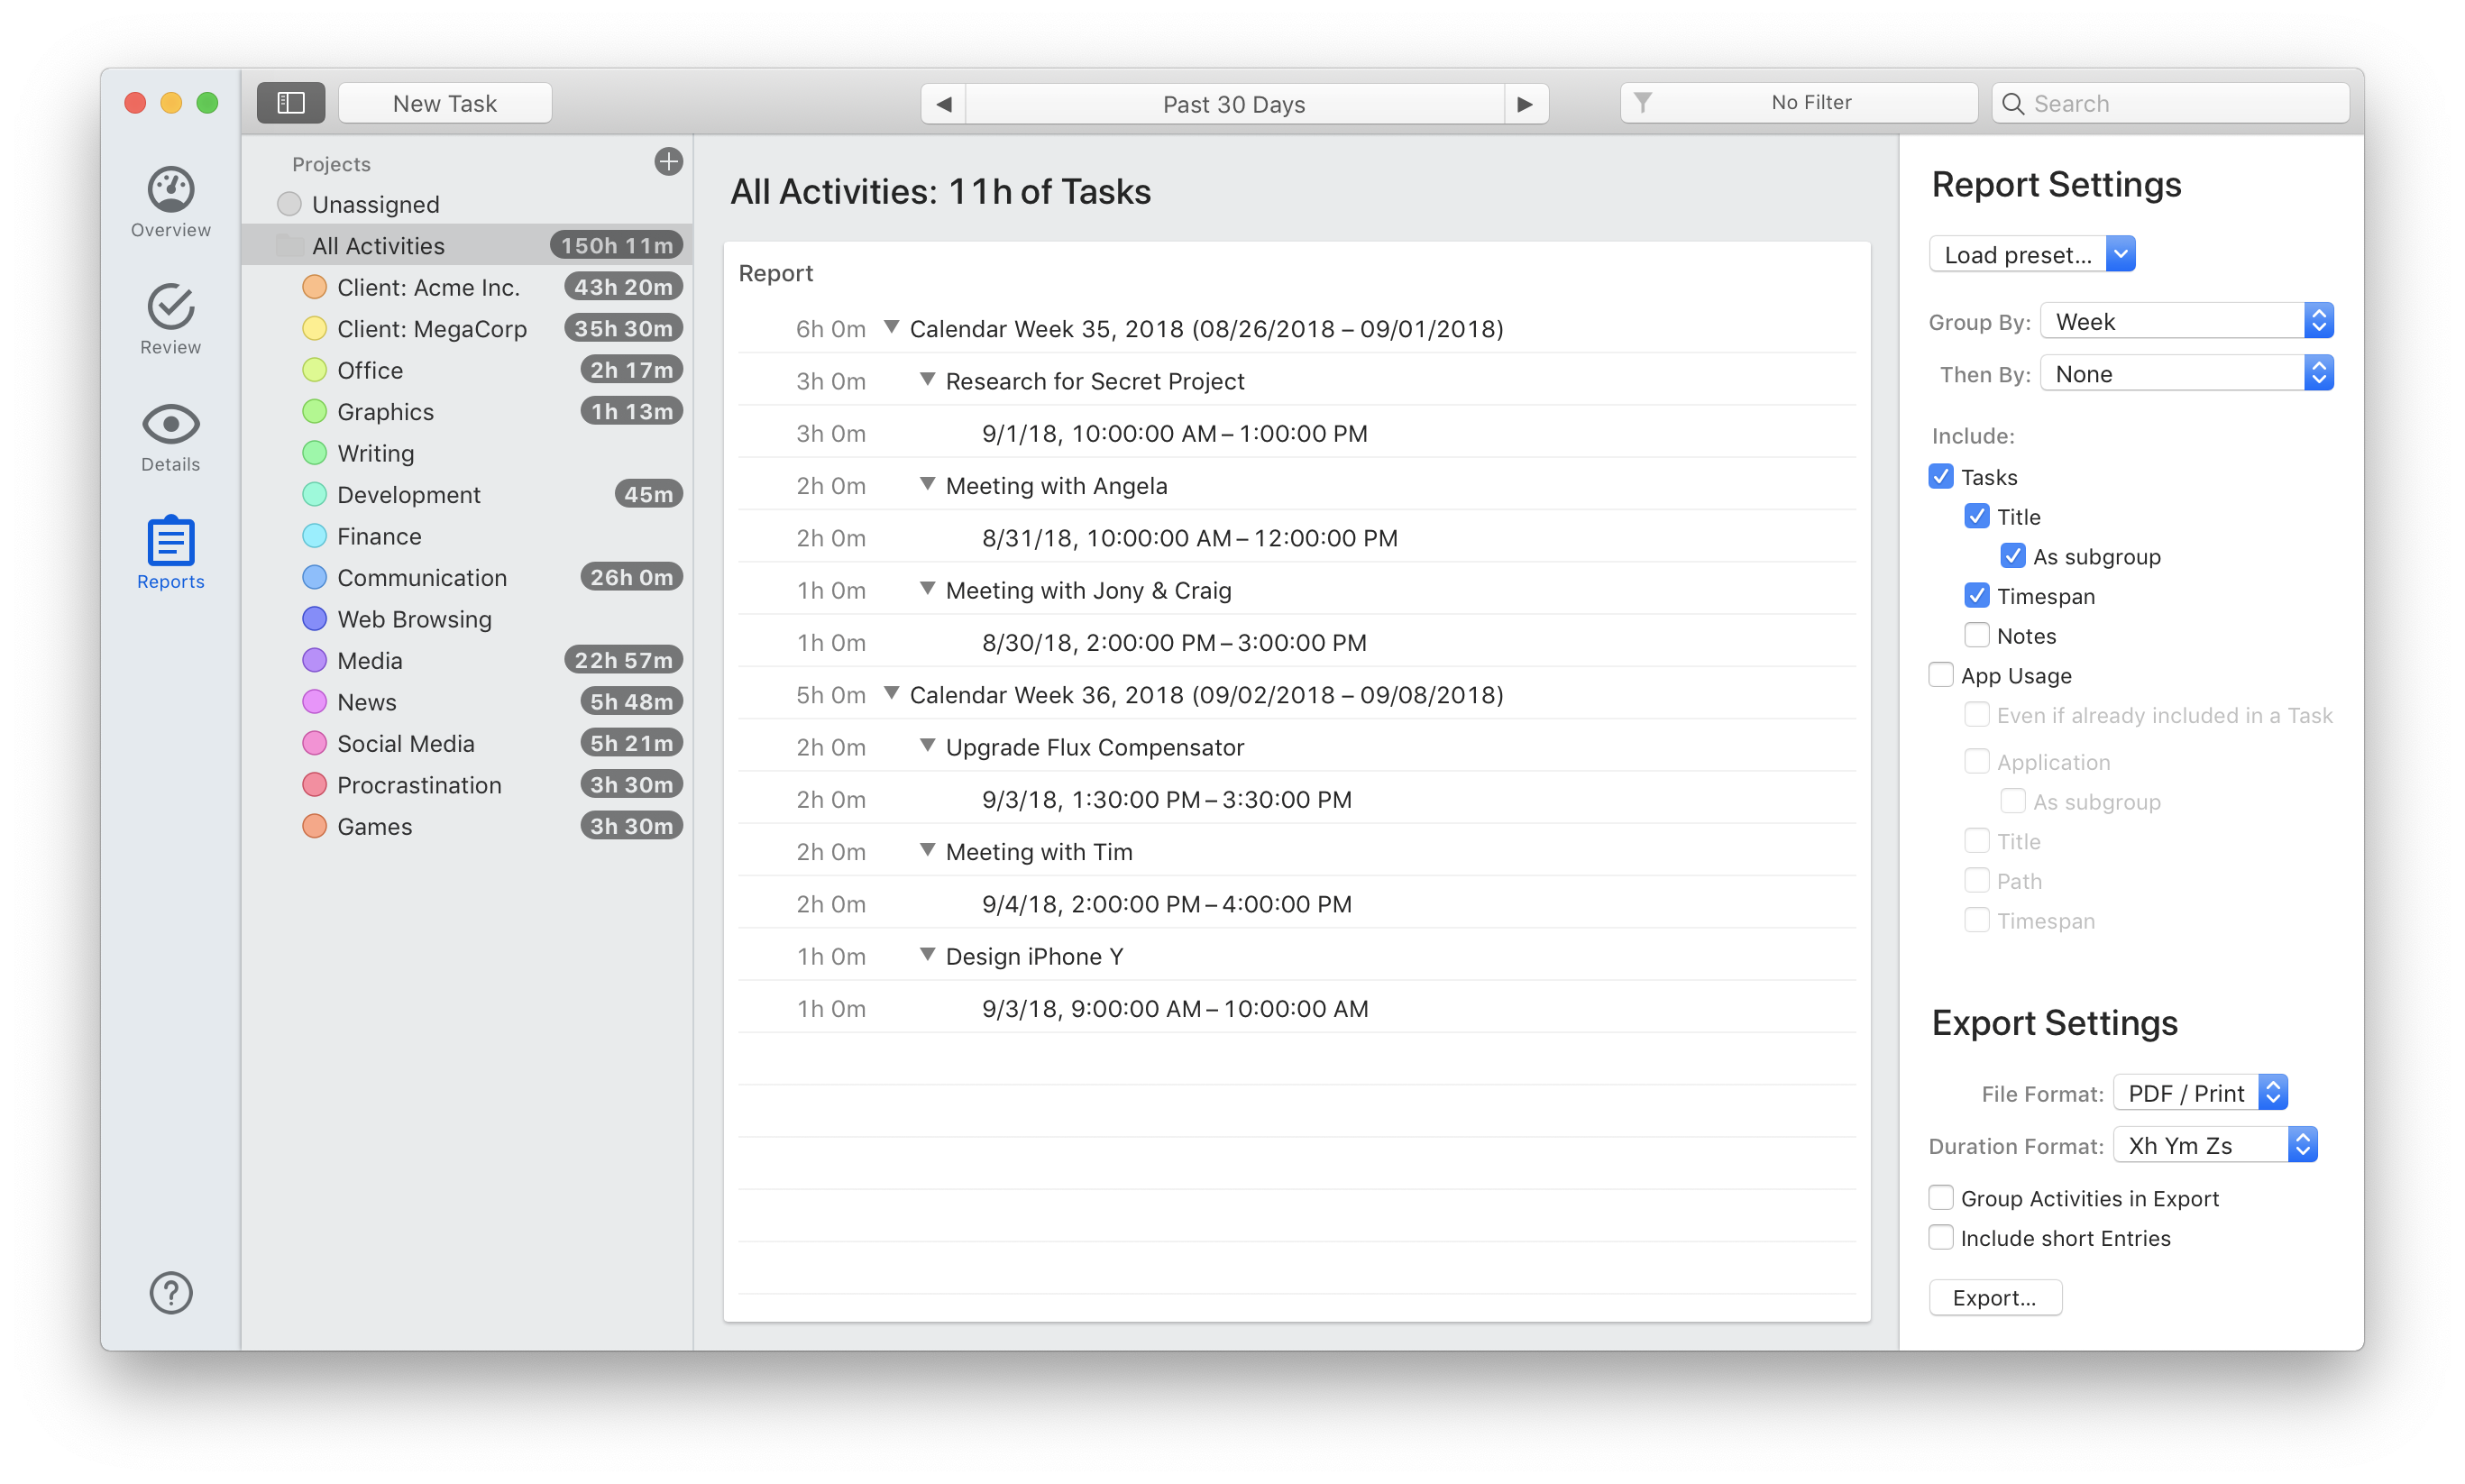
On the right side of the page, you’ll see “Report Settings.” At the top of Report Settings, you’ll choose a preset. Depending on the kind of report you want to generate, you have a variety of presets to choose from:
Timesheet
Your basic timesheet will divide your time up by day to show you how many total hours and minutes you worked, broken down per project. Time that you explicitly accounted for by creating tasks is listed next to the remaining app time you spent on those projects.
This kind of report might come in handy for your personal usage, or if you work for a single employer for whom you bill all your hours.
Timesheet (Week + Day)
If you would prefer to see your time broken down by week and day, rather than day and project, you can select Timesheet (Week + Day). This will allow you to see how much time you’ve spent each week for a selected period (such as one month), and then per day.
This preset is a good place to start for billing hours to a particular client. If you would like to restrict the report to individual projects, you can do so. Simply select the project (or client) of your choice in the project list on the left hand side to see only hours and minutes displayed for that project.
Weekly Snippet
If you’d like to see your time broken down per week, select “Weekly Snippet.” This allows you to see everything you did in a given week, and is particularly useful if you block your time into tasks. The Weekly Snippet can be a useful tool if you report time back to an employer at the end of every week, or just to get a feel of all the things you accomplished during the week.

Time Per App
This preset is similar to the “Applications” card on the Overview screen, in that it displays the time you spend per application–for example, Chrome, Microsoft Word, DEVONThink, Adobe Acrobat, or Excel.
Time Per Document
Time Per Document displays the amount of time you’ve spent on specific documents or websites. This may be particularly useful if you would like to bill a client for a single project created on a document (such as a content writer billing for an article).
Ultra-Detailed
The ultra-detailed preset breaks down your time usage into fine detail, displaying each day and what you were doing by the hour, broken down into minutes. An ultra-detailed report won’t be necessary in most cases, but may prove useful if you need to parse apart your time for a particular client or project.
Raw Tasks
Raw tasks breaks down your time per task in chronological fashion.This preset will only be useful if you use the Tasks function in Timing, and is probably the most practical as a starting point for further processing. This is an example of what raw tasks might look like:
Raw App Usage
Similarly to Raw Tasks, Raw App Usage breaks your time down per application, displayed in chronological order for a given date range. Raw App usage provides extensively detailed data that will most likely only be useful to you for further processing.
“Group By” to Further Narrow Down Your Results
Now that you’ve chosen a preset, you’ll want to further narrow down your data by using the “Group By” function, located directly below the preset menu.
Group By allows you to group your data by time period (i.e. Year/Month/Week/Day), or by project. You can also group by “top-level project or second-level project”. For example, if you have a project called “Project A” as a sub-project of “Client X”, “Client X” would be the top-level project and “Project A” the second-level project. Note that customizing what to group by requires a Timing Expert license.
This should make it easier to generate reports spanning multiple sub-projects–ideal for clients for whom you have multiple projects.
Next Level Reporting: What to Include?
To fine-tune your report even more, you can choose to include (or omit) Task titles, Timespan, Notes, and App Usage in your report. This can make the report clearer and easier to navigate for your client or other recipient. Since your App Usage is automatically absorbed into Tasks, you won’t want to check “Even if already included in a task,” as that can lead to double counting.
Once you’re satisfied with the amount of detail in your report, you’re ready to export…
Exporting Your Report
Now, you’re ready to generate your fresh, accurately detailed report. One of the benefits of using Timing is that it gives you a variety of formats in which to export your time, including:
- Excel. Timing can export your data as an XLSX spreadsheet, useful for further processing.
- CSV, or “Comma-Separated Values” format, is useful for importing data into other apps, such as an invoicing tool.
- PDF / Print comes in handy when you want to provide a timesheet along an additional document, such as your invoice.
- HTML looks similar to the PDF format, but better-suited for manual customization or hosting on a website.
You have the option of choosing a duration format for your time-tracking report. For example, if you would like 2 hours, 35 minutes, and 42 seconds to be displayed as 02:35:42, then you’ll choose the XX:YY:ZZ format. If it’s the case that you would prefer 2h 35m 42s, then you’ll choose Xh Ym Zs. The “Fractional Hours” and “Fractional Seconds” formats are mostly useful when you want to further process this data in e.g. Excel.
If you’d like, you can also display the criteria selected by “Group By” in the report. Simply select “Group Activities in Report.”
Finally, if you’re looking to generate an extremely detailed report, you can “include short entries” in the report (entries that took just a few minutes, or less than one minute).
Now, click “Export” and you’re ready to go!
Create Accurate, Clean Reports with Timing
If you’d like to generate detailed, accurate reports such as those described above–but you’re not yet a Timing user–you can give Timing a free trial here. See for yourself how this time-tracking application can help you automatically generate reports for improved invoicing and overview of your time usage.